Understanding your soil’s water-holding capacity transforms irrigation decisions from guesswork into precision management. The soil moisture release curve, also called the water retention curve, maps the relationship between soil water content and the energy required for plants to extract that moisture. This scientific tool reveals exactly when your crops shift from thriving to struggling, helping you time irrigation for maximum efficiency and minimal waste.
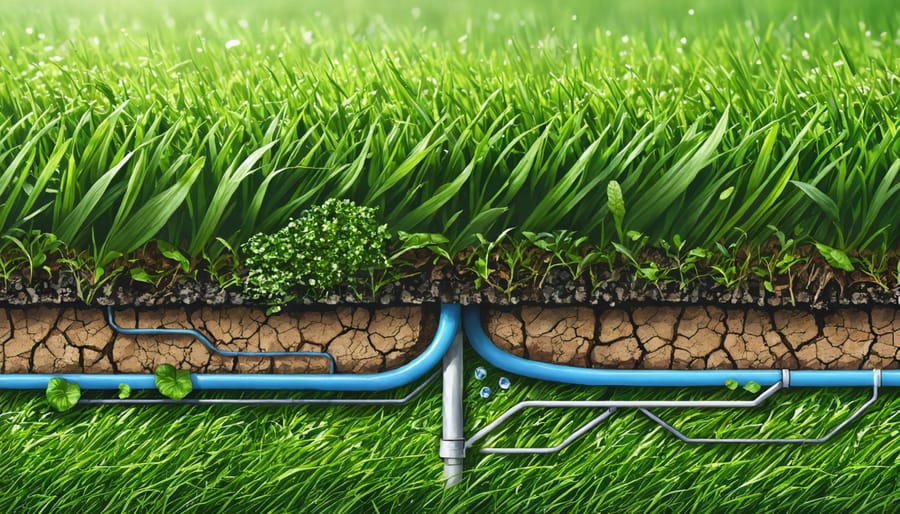
For Alberta farmers facing increasingly variable precipitation patterns, this curve acts as your soil’s unique fingerprint. Sandy soils release water quickly at low tension, requiring frequent but lighter irrigation. Clay-heavy soils hold water tightly, meaning less frequent watering but careful monitoring to prevent waterlogging. The curve quantifies these differences through measurable data points, showing you the optimal moisture range where your specific soil delivers water readily to crop roots.
The practical power lies in identifying your soil’s field capacity (the sweet spot after gravity drainage) and permanent wilting point (when crops can no longer extract water). Between these two measurements sits your available water capacity, the zone where irrigation scheduling makes or breaks your yields. Saskatchewan research from 2019 demonstrated that farmers using moisture release curves reduced irrigation costs by 23 percent while maintaining yields, proving this isn’t just academic theory.
Learning to read and apply your soil’s moisture release curve means shifting from calendar-based watering to demand-based precision. The investment in understanding this relationship pays dividends through improved water efficiency, healthier crops, and reduced input costs across growing seasons.
What Is a Soil Moisture Release Curve?
The Science Made Simple
Think of your soil like a sponge holding water after a good rain. The soil moisture release curve simply shows how tightly your soil holds onto that water as it dries out. Let’s break down three key points on this curve that matter for your farm.
Field capacity is when your soil is comfortably full of water, like a wrung-out sponge. This happens about 24-48 hours after irrigation or heavy rain, once gravity has drained the excess water away. In Alberta’s clay loam soils, field capacity typically means your soil is holding around 35-40% water by volume. Your crops are happy here, with easy access to moisture.
Permanent wilting point is the opposite end – when soil holds water so tightly that plant roots simply can’t pull it out anymore. Even if there’s still some moisture present, your crops can’t access it. For most Alberta soils, this occurs around 15-20% moisture content. At this point, your canola or wheat will start showing serious stress.
Available water capacity is the sweet spot between these two points – the moisture your crops can actually use. A soil with high available water capacity acts like a larger reservoir, giving you more flexibility between rainfall or irrigation events. Sandy soils around Taber might hold 8-10 centimetres of available water per metre of soil depth, while heavier textured soils near Lethbridge can hold 15-18 centimetres. Understanding your farm’s available water capacity helps you plan irrigation schedules and select drought-tolerant varieties when needed.
What Your Curve Says About Your Soil
Think of your soil’s moisture release curve as its unique fingerprint—each soil type tells a different story about water availability for your crops.
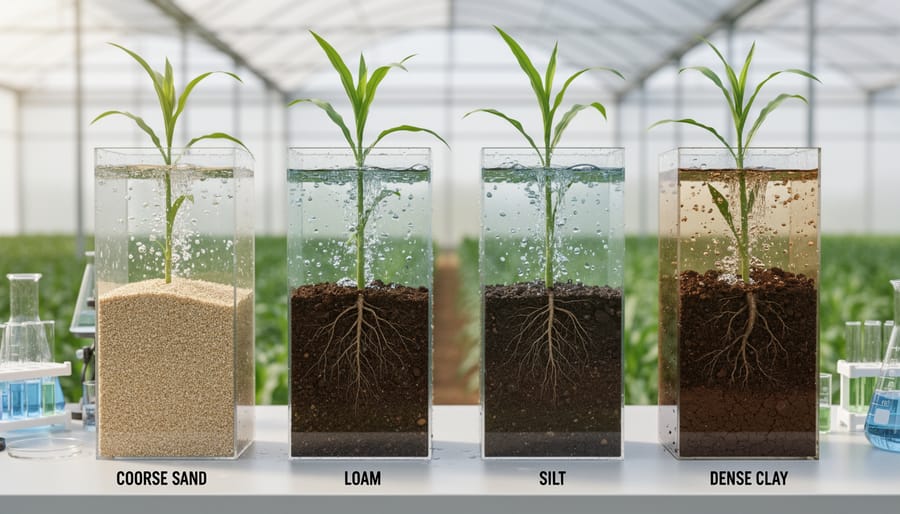
Sandy soils, common in southern Alberta’s irrigation districts, show a steep curve that drops off quickly. These soils drain rapidly, releasing most of their water at low tensions. While this means excellent drainage after heavy rains, it also indicates sandy soils hold less plant-available water. Your crops can access moisture easily at first, but you’ll need more frequent irrigation since water doesn’t stick around long.
Clay soils present the opposite challenge. Their curves are flatter and extend further, showing they hold onto water much more tightly. Clay-heavy fields in the Peace Country can retain significant moisture, but much of it becomes unavailable to plants because it’s held too tightly in those tiny soil pores. Your crops might struggle to extract water even when soil moisture levels seem adequate.
Loam soils, like those found in central Alberta’s parkland region, offer the sweet spot. Their curves show a gradual release pattern, providing a larger window of plant-available water. These soils hold moisture longer than sand but release it more readily than clay, giving your crops consistent access throughout the growing season.
Understanding your specific curve helps you time irrigation more effectively and choose crop varieties suited to your soil’s water-holding characteristics. It transforms soil moisture from guesswork into measurable management.
Reading Your Soil’s Water Story
Key Points on the Curve That Matter to Your Bottom Line
Understanding the key zones on your soil moisture release curve helps you make smarter irrigation decisions that protect both your crops and your water budget. Three critical points deserve your attention when managing irrigation across Alberta’s diverse growing conditions.
The field capacity point, typically occurring at -33 kPa of tension, represents the sweet spot where your soil holds maximum plant-available water after drainage. For Alberta canola growers, maintaining moisture near this level during flowering maximizes pod development. At this tension, a loam soil might hold 25-30% moisture by volume, while sandy soils common in southern Alberta hold closer to 15-20%.
The permanent wilting point at -1500 kPa marks your absolute deadline for irrigation. Once soil reaches this tension, crops like wheat and barley cannot extract remaining water, leading to irreversible damage. The zone between field capacity and permanent wilting point represents your plant-available water—the resource you’re actively managing with every irrigation decision.
The most critical zone for profitability sits at the management allowed depletion point, usually between -50 to -100 kPa depending on your crop. This threshold, where you should trigger irrigation, prevents stress without wasting water. Research from Alberta producers shows that irrigating barley when soil reaches -70 kPa maintains yield while reducing water use by 15-20% compared to earlier intervention. Similarly, potato growers targeting this zone during tuber bulking see improved quality without excess application.
By integrating these tension points with precision irrigation strategies, you can schedule applications that match crop demand rather than guesswork. Soil moisture sensors measuring these exact tension points remove uncertainty, letting you irrigate confidently at optimal times while maximizing every cubic metre of water applied.
Soil Moisture Retention Strategies That Work in Alberta
Organic Matter: Your Soil’s Water Bank
Think of organic matter as your soil’s natural savings account for water. When you increase organic matter content, you’re fundamentally changing how your soil holds and releases moisture, shifting the moisture release curve in ways that benefit your crops during both wet and dry periods.
Organic matter works like a sponge in your soil structure. For every 1% increase in soil organic matter, you can expect to improve water holding capacity by approximately 15,000 to 25,000 liters per hectare in the top 15 centimeters of soil. That’s significant moisture available when your crops need it most during those critical growth stages.
Alberta farmer James Peterson from Lacombe saw this firsthand. After three years of dedicated organic matter building, his soil organic matter increased from 2.8% to 4.1%. “The difference during our dry spell last July was remarkable,” he explains. “Fields with higher organic matter maintained moisture levels that kept our canola flowering while neighboring fields were stressed.”
Building organic matter takes commitment, but the methods are straightforward. Cover cropping is one of the most effective approaches. Plant species like winter rye or hairy vetch after harvest to add biomass and protect soil structure. Many Alberta farmers are seeing excellent results with fall-seeded covers that winter kill, eliminating spring termination concerns.
Compost applications provide immediate organic matter boosts, though sourcing quality material matters. Apply 10 to 20 tonnes per hectare every three to four years for measurable improvements.
Reduced tillage or no-till practices preserve existing organic matter while allowing new material to accumulate. This practice aligns perfectly with improving soil moisture retention strategies many producers are already implementing.
The payoff extends beyond water holding capacity. Soils richer in organic matter release moisture more gradually across the curve, meaning plants access water at lower tensions for longer periods.
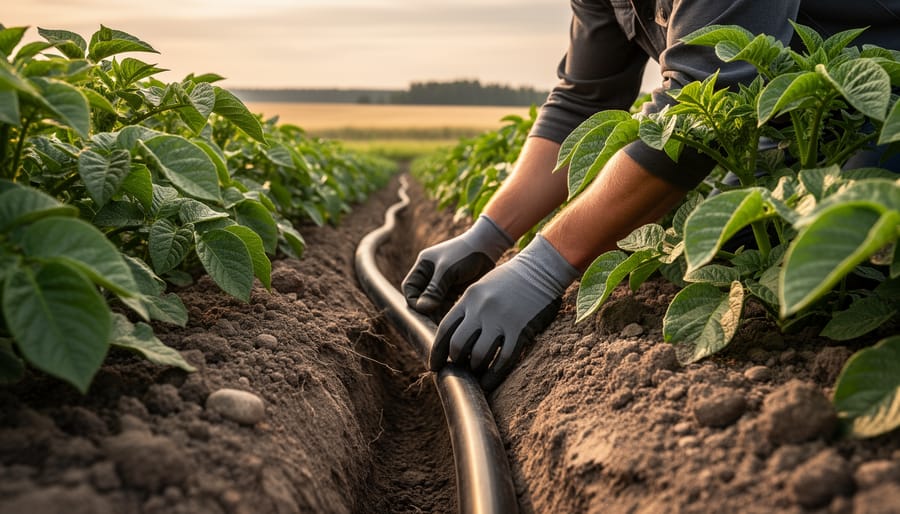
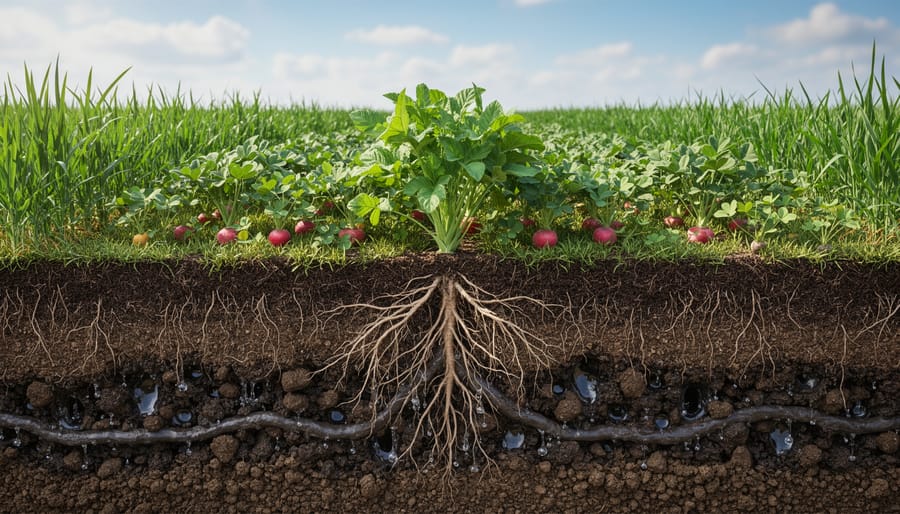
Cover Cropping for Year-Round Protection
Cover crops are one of your most powerful tools for improving how your soil holds and releases water. When you plant species like fall rye, hairy vetch, or oilseed radish between cash crop seasons, their roots create channels that enhance water infiltration while their residue acts like a protective blanket, reducing evaporation. This dual action shifts your soil moisture release curve favorably, meaning your soil holds more plant-available water during dry periods.
For Alberta conditions, winter-hardy varieties work best. Fall rye establishes quickly before freeze-up and provides excellent spring residue. Red clover fixes nitrogen while improving soil aggregation, and oilseed radish breaks up compaction layers with its deep taproot, creating pathways for water storage in the subsoil.
Take the experience of Mark Jensen from Lacombe County. After five years of incorporating fall rye and hairy vetch into his rotation, soil testing revealed his water holding capacity increased by 18 percent in the top 30 centimeters. “During the 2021 drought, my fields with cover crop history maintained yields 12 bushels per acre higher than conventional fields,” Mark shared. His soil now releases moisture more gradually during dry spells, giving crops consistent access to water.
The key is viewing cover crops as an investment in your soil’s water bank account. Each season builds organic matter, improves structure, and enhances your soil’s ability to capture and release moisture when your cash crops need it most.
Mulching and Surface Management
Your soil moisture release curve reveals how much water your soil can hold, but keeping that water there requires smart surface management. Organic mulches and crop residues create a protective barrier that dramatically reduces evaporation, helping you maximize the retention capacity your curve indicates.
Apply 5-10 cm of straw, wood chips, or shredded leaves around plants and between rows. This layer moderates soil temperature and slows water loss, particularly valuable during Alberta’s dry summer months. Many producers report 25-40% reductions in irrigation needs after implementing effective mulching practices.
Leaving crop residues on fields after harvest works similarly. A central Alberta grain farmer found that maintaining wheat stubble through winter increased spring soil moisture by 15%, directly supporting earlier seeding and stronger establishment. The residue slows wind, traps snow, and reduces freeze-thaw cycling.
When your moisture release curve shows limited water-holding capacity, mulching becomes even more critical. It compensates for inherent soil limitations by keeping available water where roots need it. Think of mulch as insurance, protecting the moisture your soil works hard to retain.
Strategic Soil Amendments
Strategic amendments can shift your soil’s moisture release curve, helping you capture and hold more water where crops need it most. Biochar and compost work differently but both improve structure—biochar creates pore spaces that hold water at lower tensions, while compost boosts aggregation and water-holding capacity throughout the curve.
Timing matters. Apply amendments before seeding or during fallow periods when you can incorporate them 10-15 cm deep. Spring application works well in Alberta, giving materials time to integrate before peak growing season. For biochar, understanding proper biochar application rates ensures you get maximum benefit without overspending—typically 5-10 tonnes per hectare shows measurable improvement.
Cost-benefit varies by operation size. Compost runs $20-40 per tonne locally, while biochar costs $200-500 per tonne. However, a southern Alberta grain producer found that even modest biochar rates reduced irrigation needs by 15% over three seasons, offsetting initial costs through water savings and yield stability during dry years.
Start small with test strips. Measure your moisture release curve before and after amendment to quantify improvements specific to your soil type, making scaling decisions based on real data rather than assumptions.
Putting Knowledge Into Practice: A Canadian Farmer’s Approach
When Derek Morrison took over his family’s 800-hectare mixed grain operation near Lethbridge in 2018, he inherited a persistent challenge: inconsistent yields in his wheat and canola fields despite what seemed like adequate irrigation. “We were watering on a schedule that my dad used for years,” Derek recalls. “But some sections would flood while others stayed bone dry.”
Everything changed when Derek attended a workshop hosted by Alberta Agriculture and Irrigation on soil moisture management. There, he learned about soil moisture release curves and how they could revolutionize his water management approach. “I’ll be honest, I thought it sounded complicated at first. But once I understood it was basically a map showing how my soil holds and releases water, it clicked.”
Derek worked with a local agronomist to develop soil moisture release curves for three distinct zones on his property: a clay loam area near the creek, sandy loam on the hillside, and a heavier clay section in the lower field. The results surprised him. “That sandy hillside was holding way less water than I assumed. Meanwhile, I was overwatering the clay section by almost 30 percent.”
Armed with this data, Derek implemented zone-specific irrigation schedules. He installed soil moisture sensors at different depths in each zone, using the release curves to determine optimal watering thresholds. “Instead of guessing when to irrigate, I now know exactly when my soil reaches the point where plants start struggling to extract water.”
The transformation took two growing seasons to fully implement, but the results speak volumes. Derek’s water usage dropped by 22 percent across the operation, saving approximately 18,000 cubic metres annually. More importantly, his canola yields increased by 15 percent in the previously under-watered sandy zone, while the clay section showed improved soil structure from reduced waterlogging.
“The economic impact has been substantial,” Derek notes. “Lower water costs, better yields, and healthier soil. My fuel costs for pumping are down too.” He estimates a return on investment within three years, considering the cost of soil testing, sensors, and consultation fees.
Derek now mentors other farmers in his region, sharing his practical experience. “Understanding your soil moisture release curve isn’t just about science—it’s about working smarter with what you’ve got.”
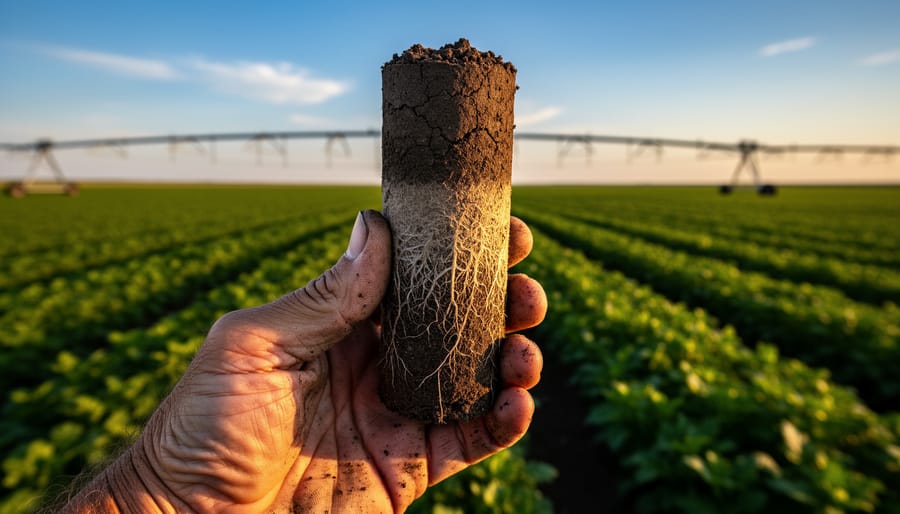
Testing and Monitoring Your Soil
Getting your soil tested for its moisture release characteristics is more accessible than many Canadian farmers realize. Several provincial labs offer this service, and it’s a worthwhile investment for long-term water management planning.
In Alberta, you can access soil moisture release curve testing through Alberta Agriculture and Irrigation’s accredited labs, as well as private agricultural testing facilities like Agvise or ALS Canada. Provincial extension services can guide you to certified labs in your area. The test typically costs between $80 and $150 per sample, depending on the lab and how detailed you want the analysis. While this might seem steep compared to basic fertility tests, remember you’re getting data that will inform irrigation decisions and soil improvement strategies for years to come.
Most agronomists recommend baseline testing when you’re first developing a moisture retention strategy. “We had three different zones on our farm tested initially,” shares Mark Henderson, a grain producer near Lethbridge. “The investment paid off within two seasons once we understood exactly where our water was going and could adjust our practices accordingly.”
After establishing your baseline, plan to retest every three to five years, or more frequently if you’re actively implementing major soil improvements like adding organic matter or changing tillage practices. This timeline allows enough opportunity for measurable changes while keeping testing costs reasonable.
When you receive your results, work with your agrologist to compare curves over time. You’re looking for shifts that indicate improved water holding capacity at field capacity, which typically shows up as the curve moving upward and to the right. Document your soil management practices alongside test dates so you can directly connect improvements to specific strategies, whether that’s cover cropping, reduced tillage, or compost applications. This data becomes your roadmap for continued improvement.
Understanding your soil moisture release curve isn’t just about having scientific data—it’s about transforming how you approach water management on your farm. By knowing exactly how your soil holds and releases water at different tensions, you remove the guesswork from irrigation decisions and retention strategies. You can choose amendments, cover crops, and management practices based on what will genuinely work for your specific soil conditions, not just what worked for your neighbour with entirely different clay content.
For Alberta farmers facing increasingly unpredictable precipitation patterns and longer dry spells, this knowledge becomes even more critical. The soil moisture release curve connects your day-to-day management decisions to broader goals of climate resilience and sustainable agriculture. Whether you’re managing sandy loam fields near Lethbridge or heavier soils in the Peace Country, understanding your curve helps you build soil that can buffer against both drought and excessive moisture events.
The best part? Getting started is straightforward. Begin with soil testing—contact your local agricultural service provider to have samples analyzed and your moisture release curve developed. Many Alberta labs now offer this service specifically for producers. Once you have your curve in hand, you’ll have a roadmap for making informed decisions about organic matter additions, tillage practices, and irrigation timing that truly match your soil’s capabilities. Your investment in understanding today builds resilience for seasons to come.