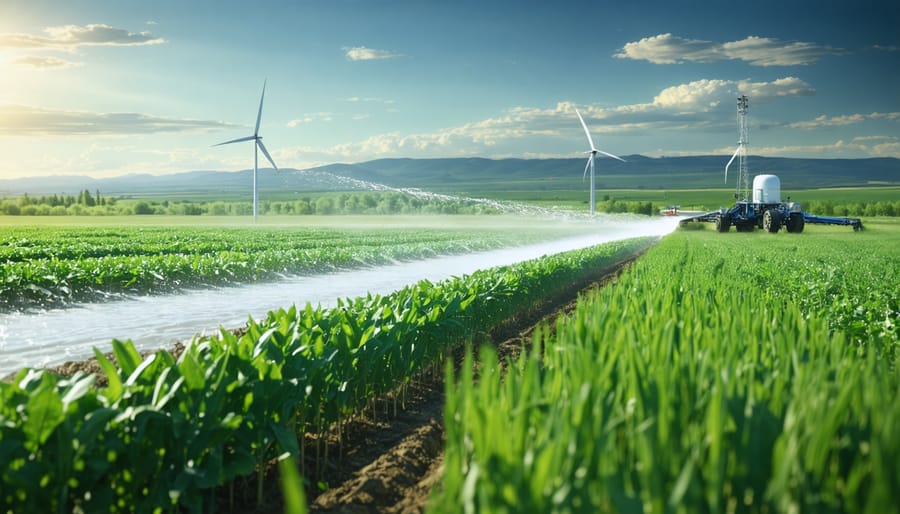
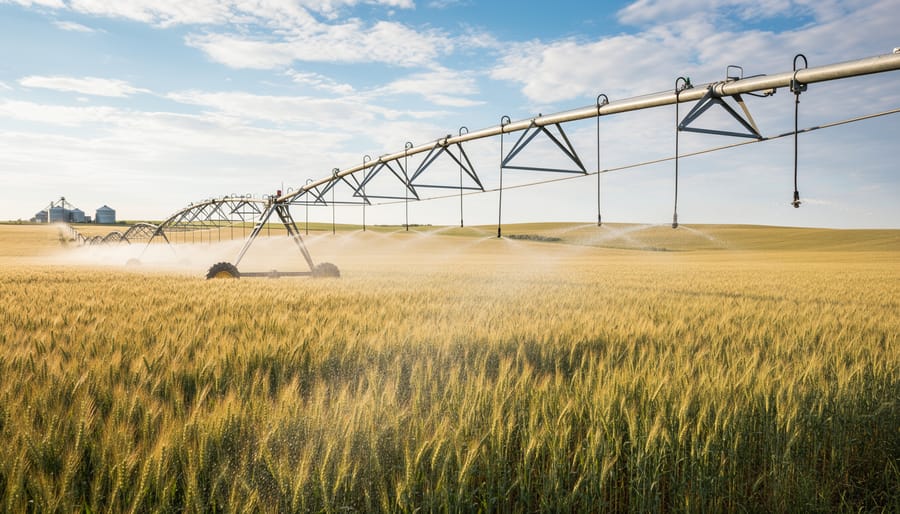
Multiply your reference evapotranspiration (ETo) by the appropriate crop coefficient (Kc) to calculate exactly how much water your crops need at each growth stage. This simple calculation transforms regional weather data into precise irrigation schedules, eliminating guesswork and reducing water waste by up to 30% on Alberta farms.
Access Alberta Agriculture’s weather station network to obtain daily ETo values specific to your location, then match these numbers with stage-specific Kc values for your crops. For canola, apply a Kc of 0.25 during emergence, increasing to 1.15 at flowering, then dropping to 0.35 before harvest. Wheat follows a similar pattern with coefficients ranging from 0.30 at establishment to 1.15 during heading. Barley, pulse crops, and forages each have distinct coefficient curves that reflect their unique water demands throughout the season.
Track your crop’s development stage weekly to adjust irrigation timing as Kc values shift. A crop at mid-season typically requires double the water compared to its establishment phase, making accurate stage identification essential for efficient water use. Combined with proven water-saving strategies, proper Kc application helps maintain yields while conserving this precious resource.
Understanding these coefficients empowers you to make data-driven decisions that protect both your bottom line and Alberta’s water security during increasingly variable growing seasons.
What is a Crop Coefficient and Why Should You Care?
The Science Made Simple
Think of your crops like different people at a gym—some are serious athletes who need lots of water, while others are more casual exercisers with modest needs. The crop coefficient, or Kc, is simply a number that tells you how much more (or less) water your specific crop needs compared to a standard reference measurement called reference evapotranspiration, or ETo.
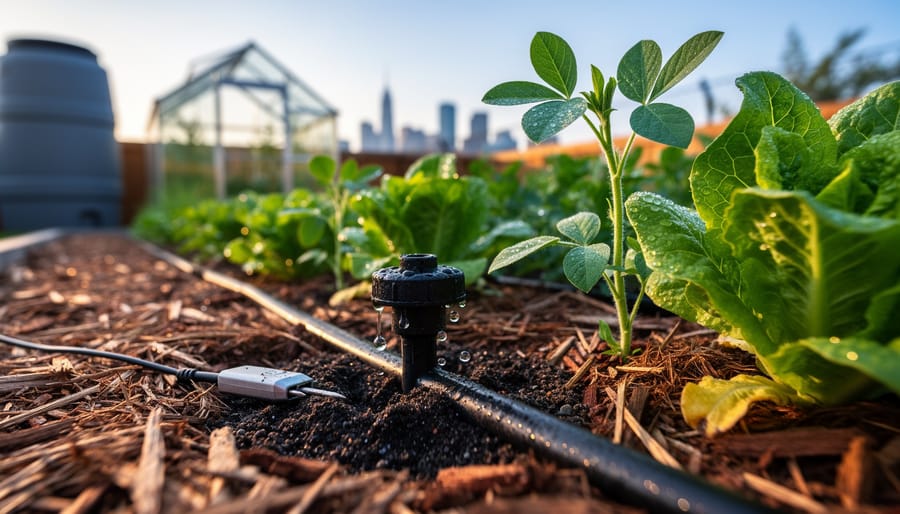
Here’s how it works in practice: ETo represents the water loss from a well-watered grass surface, which weather stations across Alberta measure daily. When you multiply ETo by your crop’s Kc value, you get the actual amount of water your crop needs that day.
For example, if today’s ETo is 5 millimetres and you’re growing canola at peak growth (Kc = 1.15), your crop needs approximately 5.75 millimetres of water. However, if you’re growing the same canola during its initial growth stage (Kc = 0.35), it only needs about 1.75 millimetres.
This simple calculation helps Alberta farmers make informed irrigation decisions, preventing both water waste and crop stress—essential for maintaining productivity while conserving our prairie water resources.
How This Saves You Money and Water
Using crop coefficient tables transforms how you manage your irrigation investment. When you apply the right amount of water at the right time, you immediately reduce pumping costs and minimize waste. Alberta farmers implementing precise agricultural water management through Kc values report water savings of 15-30 percent compared to traditional methods.
Beyond lower utility bills, proper irrigation scheduling prevents overwatering that can leach nutrients from soil and stress crops. A canola producer near Lethbridge reduced water use by 8,000 cubic metres per season while maintaining yield, saving approximately $2,400 annually in water and energy costs. Better water management also means healthier crops with stronger root systems and improved disease resistance.
The environmental benefits matter too. Conserving water protects Alberta’s rivers and aquifers for future generations while reducing your farm’s energy footprint. You’re making your operation more resilient against drought conditions and contributing to sustainable agriculture across the province. Every litre saved keeps your costs down while supporting the land that supports your livelihood.
Crop Coefficient Tables for Alberta’s Major Crops
Cereal Crops (Wheat, Barley, Oats)
Cereal crops form the backbone of Alberta’s agricultural landscape, and understanding their water needs throughout the growing season helps you optimize irrigation while conserving this precious resource. For wheat, barley, and oats, crop coefficients vary significantly as plants move through distinct growth phases.
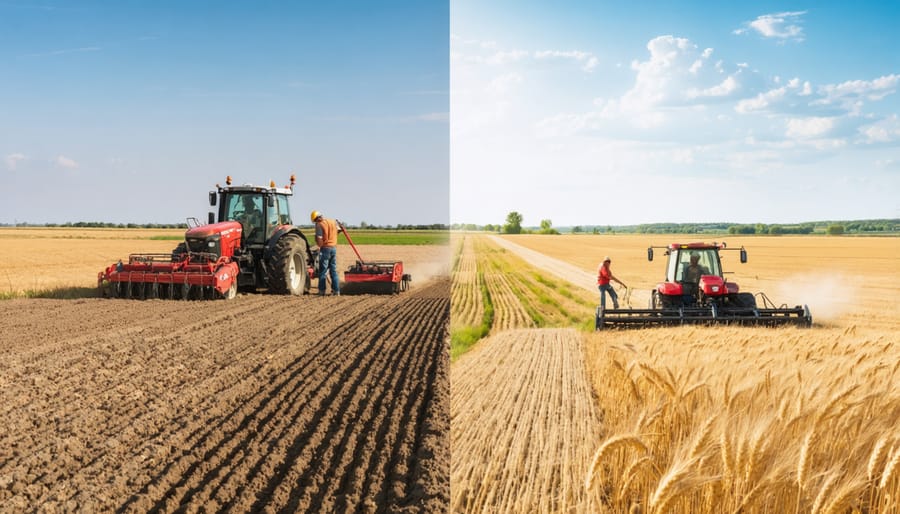
During the initial stage (late April to early June), when seedlings are establishing, Kc values range from 0.30 to 0.40. At this point, your plants cover minimal ground and require less water relative to reference evapotranspiration. As cereals enter their mid-season phase (mid-June through July), they reach peak water demand with Kc values climbing to 1.10-1.15 for wheat and barley, while oats typically reach 1.05-1.10. This stage coincides with heading and grain fill, when adequate moisture directly impacts your yield potential.
The late-season period (August to early September) sees declining water needs as crops mature and prepare for harvest. Kc values drop to 0.25-0.40, reflecting reduced plant activity and decreasing soil moisture requirements.
Alberta farmers report that applying these coefficients has helped them reduce water usage by 15-20 percent without sacrificing crop quality. Local agronomist Sarah Chen notes, “Understanding these growth stage variations allows producers to time irrigation precisely when crops need it most, particularly during that critical mid-season window.”
Remember that these values represent general guidelines. Your specific field conditions, including soil type and microclimate, may require adjustments for optimal results.
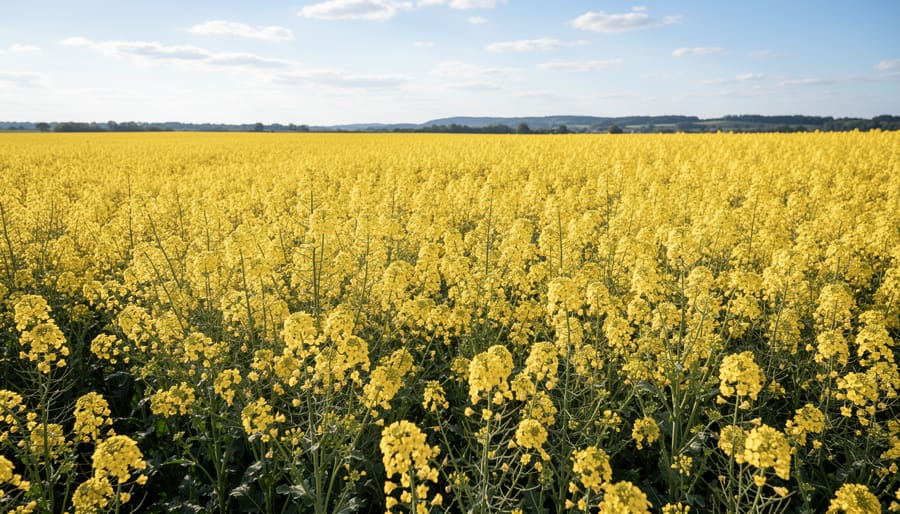
Canola and Other Oilseeds
Oilseed crops require careful water management to maximize both yield and oil content. Understanding their crop coefficients helps you apply the right amount of irrigation at each growth stage, which is particularly important for Alberta producers managing these valuable crops.
For canola, initial Kc values typically range from 0.35 during emergence to 1.15 at peak flowering. The mid-season stage (flowering to pod development) shows values around 1.00-1.15, dropping to 0.35-0.50 during late-season maturation. Flax follows a similar pattern with initial values of 0.35, mid-season peaks of 1.10, and late-season values decreasing to 0.25-0.35 as the crop approaches harvest.
Sunflower crops demonstrate slightly higher water demands during flowering, with initial Kc values of 0.35, mid-season coefficients reaching 1.15-1.20, and late-season values of 0.35-0.60. The flowering stage is critical for sunflowers, as water stress during this period directly impacts seed formation and oil quality.
Alberta producers should note that these oilseeds are generally sensitive to both under and over-irrigation. Monitor soil moisture closely during the reproductive stages when these crops have their highest water requirements. Local agronomists recommend adjusting these baseline coefficients based on your specific field conditions, planting dates, and variety selections for optimal results.
Pulse Crops (Peas, Lentils, Chickpeas)
Pulse crops have become increasingly popular across Alberta, offering excellent nitrogen-fixing benefits while requiring moderate water inputs. Understanding their crop coefficients helps you optimize irrigation schedules throughout the growing season.
For field peas, initial Kc values start around 0.40 during emergence, increasing to 1.15 at peak flowering and pod development, then declining to 0.30-0.35 as plants reach maturity. Lentils follow a similar pattern with slightly lower peak values of 1.05-1.10 during mid-season. Chickpeas, being slightly more drought-tolerant, maintain peak Kc values around 1.00-1.05.
Timing is critical for pulse crops in Alberta’s climate. Your initial stage typically runs 20-25 days after planting, with development extending another 30-35 days. The mid-season stage, when water demand peaks, lasts approximately 35-40 days, followed by a 15-20 day late-season period.
Alberta pulse growers have found success by monitoring soil moisture carefully during flowering, as stress during this period significantly impacts yield. Many producers reduce irrigation as pods begin to dry, using the lower late-season Kc values to prevent excess moisture that could delay harvest. Consider your specific pulse variety and planting date when applying these coefficients, as northern Alberta’s cooler temperatures may extend growth stages compared to southern regions.
Forage and Hay Crops
Forage and hay crops require careful water management, especially when planning for multiple cuttings throughout the growing season. Understanding crop coefficients helps you optimize irrigation timing and amounts between harvests.
Alfalfa stands out as a high water user with Kc values ranging from 0.40 at initial growth to 1.20 during peak growth stages. After each cutting, the coefficient drops back to approximately 0.50 and rebuilds as the crop regrows. Alberta producers typically manage three to four cuttings per season, making it essential to track growth stages carefully.
Timothy grass shows more moderate water needs, with coefficients ranging from 0.30 initially to 1.05 at peak growth. Mixed hay varieties generally fall between these ranges, depending on the grass-legume ratio in your fields.
Many Alberta farmers adjust irrigation schedules based on cutting intervals. “We’ve reduced water use by 20 percent since implementing Kc-based scheduling for our alfalfa fields,” shares Tom Richardson, a central Alberta hay producer. Monitor regrowth closely after each cutting, as this significantly impacts your irrigation requirements and overall yield quality throughout the season.
Specialty Crops and Vegetables
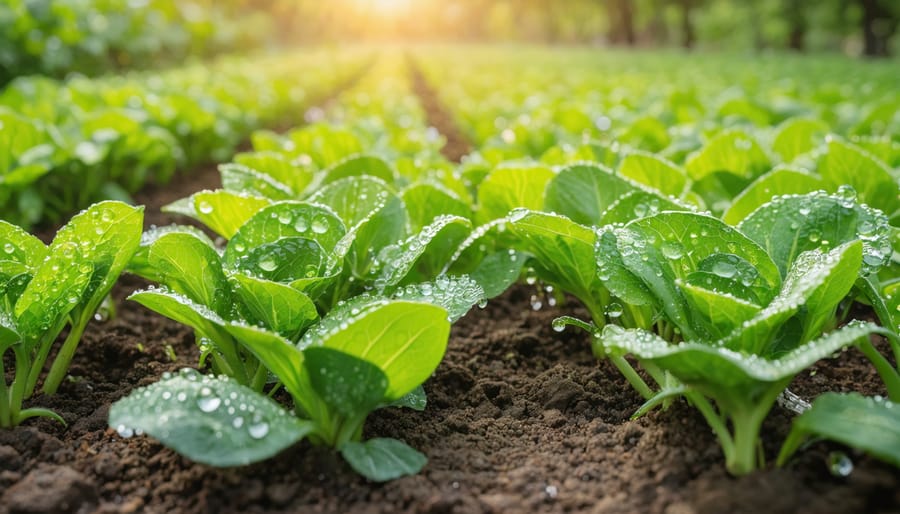
Alberta’s specialty crops require careful irrigation management, and understanding crop coefficients helps you optimize water use while maximizing yields. Potatoes, a significant crop in southern Alberta, have varying Kc values throughout the season: 0.5 during initial growth, peaking at 1.15 during mid-season when tubers develop, and dropping to 0.75 during late season. For common vegetables, lettuce maintains coefficients of 0.7 initially, 1.0 at peak growth, and 0.95 late season, while carrots range from 0.7 to 1.05 during their growth cycle.
Onions typically start at 0.7, reach 1.05 at bulb development, and finish at 0.85. Sweet corn follows a pattern of 0.3 initially, 1.15 during tasseling and ear formation, then 1.05 toward harvest. Local producer Sarah Chen from Taber shares her experience: “Using these coefficients reduced our irrigation costs by 18% while improving our potato quality.” Remember that these values work best when combined with soil moisture monitoring and local weather data for precise irrigation scheduling.
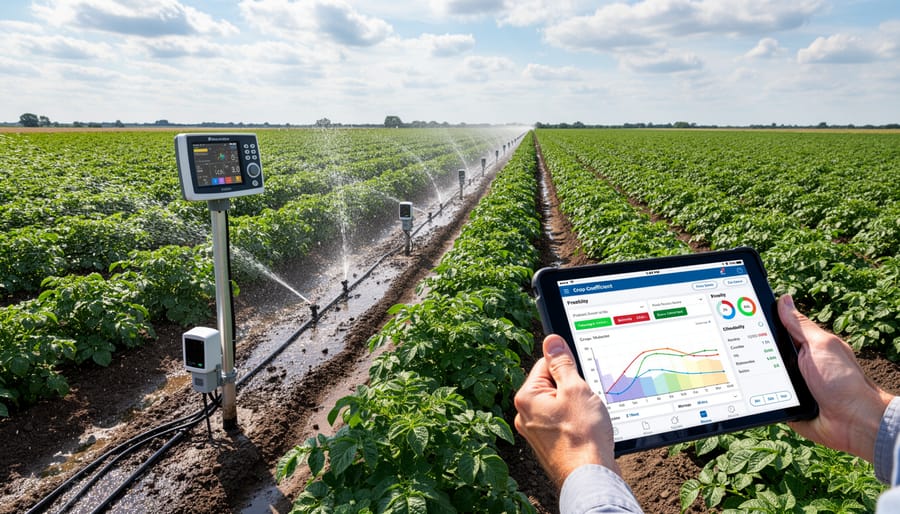
How to Apply Crop Coefficients to Your Operation
Getting Your Reference Evapotranspiration Data
To calculate your irrigation needs accurately, you’ll need reliable reference evapotranspiration (ETo) data for your specific location in Alberta. Fortunately, several excellent resources are available to Alberta farmers.
The Alberta Climate Information Service (ACIS) provides free access to weather data and calculated ETo values from stations across the province. Visit agriculture.alberta.ca and search for their agroclimatic information tools, which offer both current and historical data. Many stations update daily during the growing season, giving you real-time information for irrigation decisions.
Alberta Agriculture’s Agricultural Water Management team also offers regional ETo estimates through their online irrigation management tools. These resources are specifically designed for Alberta’s growing conditions and can be accessed through their main website.
For those wanting automated updates, several private weather station networks like WeatherFarm and local irrigation district websites provide ETo calculations tailored to your area. Many irrigation districts in southern Alberta maintain their own weather stations and share data with members.
Consider connecting with your local agricultural fieldman or regional irrigation specialist, who can guide you to the most reliable data sources for your specific region and help interpret the information for your operation.
The Simple Calculation You’ll Use All Season
Understanding how much water your crops need doesn’t require complex calculations. The formula is straightforward: Crop Water Need = ETo × Kc. Here’s how it works in practice.
ETo represents the reference evapotranspiration, which is the amount of water that would evaporate from a well-watered grass surface. You can get this data from your local Alberta weather station or through Alberta Agriculture’s Agroclimate Information Service.
Kc is your crop coefficient from the table, which adjusts the ETo based on your specific crop and its growth stage.
Let’s walk through a real example. Say you’re growing spring wheat in central Alberta during mid-July. Your local ETo reading is 6 mm per day, and your wheat is in the heading stage with a Kc value of 1.15.
Crop Water Need = 6 mm × 1.15 = 6.9 mm per day
This means your wheat requires approximately 7 mm of water daily during this growth stage. If no rain falls, you’ll need to provide this through irrigation to maintain optimal growth.
For canola at peak flowering with an ETo of 5.5 mm and Kc of 1.10, the calculation gives you 6.05 mm daily. Many farmers using precision irrigation systems apply this formula to schedule their watering efficiently, reducing waste while maximizing yields.
Adjusting for Your Specific Conditions
While crop coefficient tables provide excellent starting points, real-world conditions across Alberta demand adjustments to achieve optimal irrigation accuracy. Your soil type significantly influences water retention, with clay soils requiring lower application rates compared to sandy soils that drain quickly. For instance, a farmer near Lethbridge working with sandy loam might increase irrigation frequency by 15-20% compared to standard Kc recommendations.
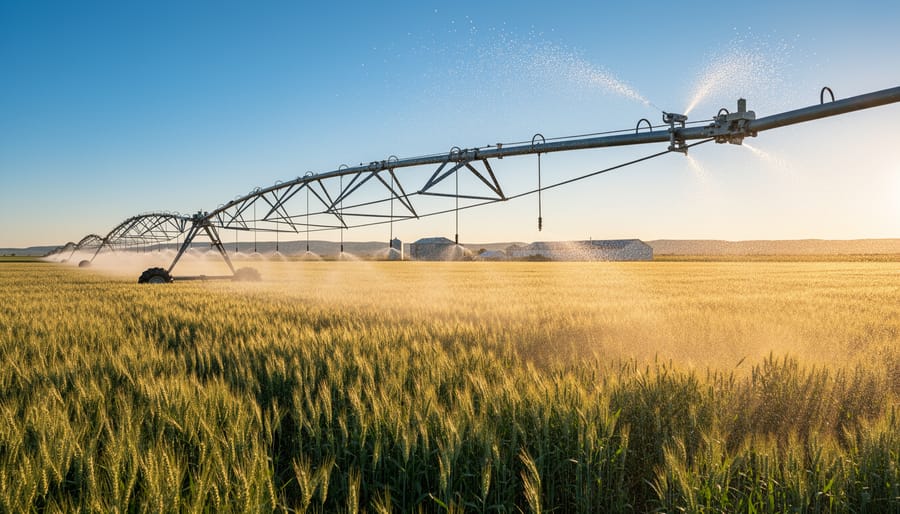
Your choice of modern irrigation methods also impacts coefficient application. Drip irrigation systems typically allow for reduced coefficients since water loss through evaporation is minimal, while pivot systems may require slight increases to account for spray drift and evaporation losses.
Weather variations matter too. During Alberta’s characteristically windy springs, increase your Kc values by 10-15% to compensate for accelerated evapotranspiration. Similarly, microclimates within your farm require attention. South-facing slopes or wind-exposed areas need higher coefficients than sheltered northern sections.
Agricultural irrigation specialist Dr. Sarah Chen from Olds College advises keeping detailed field notes for at least two growing seasons. This practice helps you develop location-specific adjustment factors that account for your unique combination of soil, topography, and microclimate conditions, ultimately improving water use efficiency across your operation.

Real Results from Alberta Farms
When Tom Hendricks started using crop coefficient tables on his 800-acre mixed farm near Lethbridge in 2019, he wasn’t sure what to expect. Like many Alberta farmers, he’d been irrigating based on experience and gut feeling. “I knew my fields needed water, but I couldn’t tell you exactly how much or when,” Tom admits.
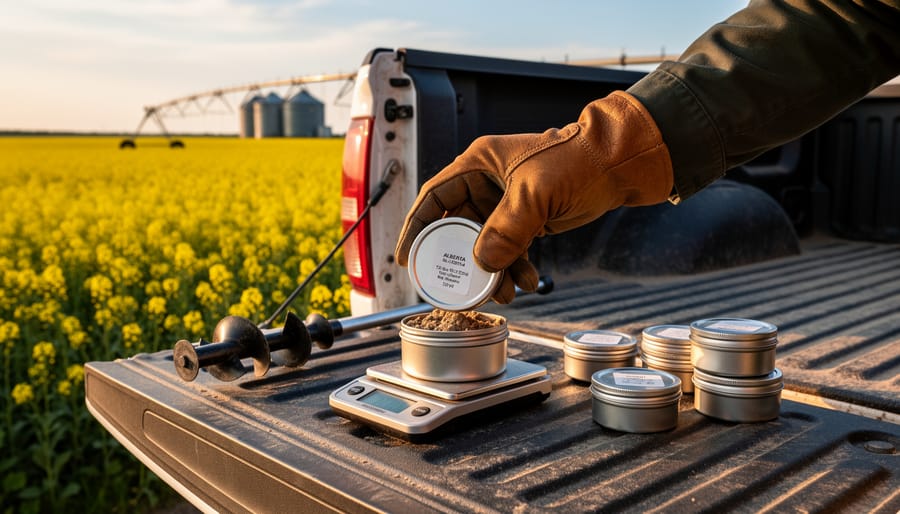
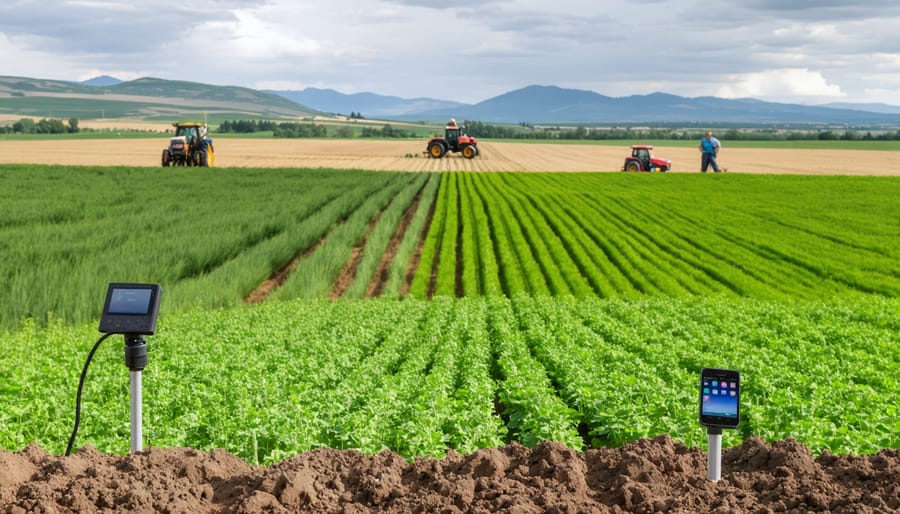
Working with an irrigation specialist from Alberta Agriculture and Irrigation, Tom began tracking crop coefficients for his wheat, canola, and potato rotations. The first step was installing soil moisture sensors in representative areas of each field and correlating the readings with the crop coefficient values for each growth stage.
The results were eye-opening. “I discovered I was over-watering my wheat by about 30 percent during the vegetative stage,” Tom explains. “I thought more water meant better yields, but I was actually creating problems with shallow root development.”
By following the crop coefficient method, Tom reduced his total water use by 22 percent in the first season while maintaining yields. His wheat averaged 62 bushels per acre, matching his five-year average despite less irrigation. The canola field actually saw a slight increase to 48 bushels per acre, which Tom attributes to better-timed water applications during the critical flowering period.
The financial impact proved significant. With water costs and pumping expenses factored in, Tom saved approximately $18,000 in the first year. More importantly, his irrigation system now runs more efficiently, reducing maintenance costs and extending equipment life.
Tom’s biggest lesson learned? “Start simple and don’t try to be perfect right away,” he advises. “I began with just one field per crop type, tracked the results, and expanded from there. The crop coefficient table gave me a framework, but I still needed to adjust for my specific soil conditions and microclimate.”
He recommends other farmers invest in basic soil moisture monitoring equipment and keep detailed records. “The numbers don’t lie. Once you see how your crops respond to precise water amounts at each growth stage, you’ll never go back to guessing.”
Today, Tom shares his experience with neighbours and at local agricultural meetings, encouraging others to embrace science-based irrigation scheduling. His success demonstrates that crop coefficient tables aren’t just theoretical tools but practical solutions for Alberta’s water conservation challenges.
Expert Insights: Making Crop Coefficients Work in Alberta’s Climate
We sat down with Dr. Jennifer Morrison, an irrigation agronomist with over 20 years of experience working with Alberta producers, to discuss how farmers can successfully apply crop coefficients in our unique climate.
“The biggest mistake I see is farmers treating crop coefficient tables like they’re set in stone,” Dr. Morrison explains. “These values are guidelines based on ideal conditions. In Alberta, we need to adjust our thinking because our growing season looks different than regions where many of these tables originated.”
She points to our shorter, more intense growing season as a key factor. “Your crops are going to reach their peak water demand faster here. A canola crop in central Alberta might hit that peak Kc value of 1.15 two weeks earlier than the table suggests. You need to be out in your fields, observing actual growth stages rather than just following calendar dates.”
When asked about the most common challenge, Dr. Morrison doesn’t hesitate. “Wind. It’s always wind. Those hot, dry Chinook winds in southern Alberta can increase evapotranspiration by 20 to 30 percent on certain days. Your standard Kc value doesn’t account for that. I tell producers to think of coefficients as a starting point, then factor in local weather patterns.”
For farmers just starting to use crop coefficients, her advice is straightforward. “Start simple. Pick one field, one crop. Monitor it closely for a season. Compare what the coefficients predict against what you observe. You’ll develop a feel for how these numbers translate to your specific land.”
Dr. Morrison emphasizes the value of local weather station data. “Alberta Agriculture and Irrigation has excellent resources. Use the ET data from the station nearest your operation. The more localized your information, the better your irrigation decisions will be.”
Her final piece of advice resonates with the practical nature of farming: “Don’t let perfect be the enemy of good. Using crop coefficients, even imperfectly, is better than guessing. You’ll refine your approach each season.”
Tools and Resources to Get Started
Getting started with crop coefficients doesn’t require expensive equipment or complicated software. Several practical tools can help you implement these values into your irrigation planning right away.
Alberta Agriculture’s Irrigation Scheduling Tool provides free access to crop coefficient data specific to our province’s growing conditions. This online calculator allows you to input your crop type, growth stage, and local weather data to receive customized irrigation recommendations. The tool draws from weather stations across Alberta, ensuring you’re working with relevant information for your region.
For on-the-go access, the AgriRecovery app developed by the Canadian government includes irrigation scheduling features with built-in crop coefficient tables. The app automatically adjusts calculations based on your location and connects to nearby weather stations for real-time evapotranspiration data.
The Alberta Irrigation Information Centre offers downloadable crop coefficient tables formatted for easy reference in the field. These printable guides include common crops grown across the province, from cereals to specialty crops, organized by growth stage.
Weather data is essential for accurate irrigation planning. The Alberta Climate Information Service provides free access to current and historical weather information from over 250 stations province-wide. This data integrates seamlessly with crop coefficient calculations to determine daily water requirements.
Combining crop coefficients with soil moisture monitoring creates a powerful irrigation management system. This dual approach validates your calculations with actual field conditions, helping you fine-tune applications throughout the season.
The Irrigation Efficiency Centre at Lethbridge College provides educational workshops and online resources specifically designed for Prairie farmers. Their materials include step-by-step guides for implementing crop coefficient-based irrigation scheduling on farms of all sizes.
Adopting crop coefficient tables into your irrigation strategy doesn’t require overhauling your entire operation overnight. Start small—choose one field or a single crop where you’ve noticed water stress or inconsistent yields. Track your results, adjust your approach, and build confidence in the process. Many Alberta farmers have discovered that even modest improvements in irrigation efficiency translate into meaningful water savings and healthier crops across their growing season.
Remember, you’re not alone in this journey toward more sustainable water management. Connect with your local agricultural extension office, join irrigation workshops, or reach out to neighbouring producers who’ve already implemented coefficient-based scheduling. The Alberta agricultural community thrives on shared knowledge and mutual support, and your questions contribute to everyone’s learning.
Water-efficient production isn’t just about conserving a precious resource—it’s about building resilience for the next generation of farmers. Every decision you make to optimize irrigation contributes to broader sustainable agriculture goals: healthier soils, reduced energy costs, and more productive farmland for years to come. Your willingness to learn and adapt makes a real difference, both for your operation and for Alberta’s agricultural future.